Have you ever found yourself in this situation:
You come up with an idea for a great list post for your blog that you know your readers will love…
You spend hours researching writing and refining it…
You invest in a great stock photo image to drive home the message and to capture the attention of your followers across social networks. Then….
 You publish it and share it across social networks such as Pinterest, Twitter and Facebook. You see a nice flow of traffic come to your site but just as quickly as it came, it goes away. Time to start the process all over again.
Is that all we as bloggers can expect out of the hard work we put into a great list post?
Is there a way that we can get more out of it rather than just let it get buried in the depths of our archives?
The good news is that we can get more milage out of them by reviving them visually in the form of infographics. Wikipedia defines infographics as “graphic visual representations of information, data or knowledge intended to present complex information quickly and clearly.”
Many infographics break down statistical data and are represented visually by piecharts and graphs. However, according to the definition given by Wikipedia, they can also be used to present information or knowledge quickly and clearly and that sounds perfect for a blog's list post.
Creating infographics doesn't require you to be a master artist or to have an arsenal of expensive tools. They can be created relatively quickly and inexpensively.
The process
Look back in your archives for a list post that you'd like to bring attention to again.
#1: Use an image editing tool.
To create an infographic you'll need an image editing tool. Canva (currently only available to beta testers) and PicMonkey are both easy to use tools for image creation and they both have free options.
#2: Decide on a look and feel for you infographic.
A good place to go for inspiration is Pinterest. A quick search for “infographics” will bring you hundreds of images to be inspired by. Be careful not to be overwhelmed or intimidated by the results. Much of what you'll find was created by professional graphic designers. Instead, look for color combinations, shapes used or simple list infographics for inspiration.
If you have a color palette for your blog, consider using those colors in your infographic to keep it consistent with your branding.
#3: Summarize each point.
Summarize each of the points on your list into a few words or a couple of short sentences. Remember, the point of infographics is to communicate information in a quick and easy to understand way so try to keep the words used in your image down to a minimum.
Infographics are great and are very popular on sites like Pinterest. But, the point of creating this image is to bring traffic back to your site. Be sure to include a call to action, your URL and your logo in the image to drive traffic to your site.
An example
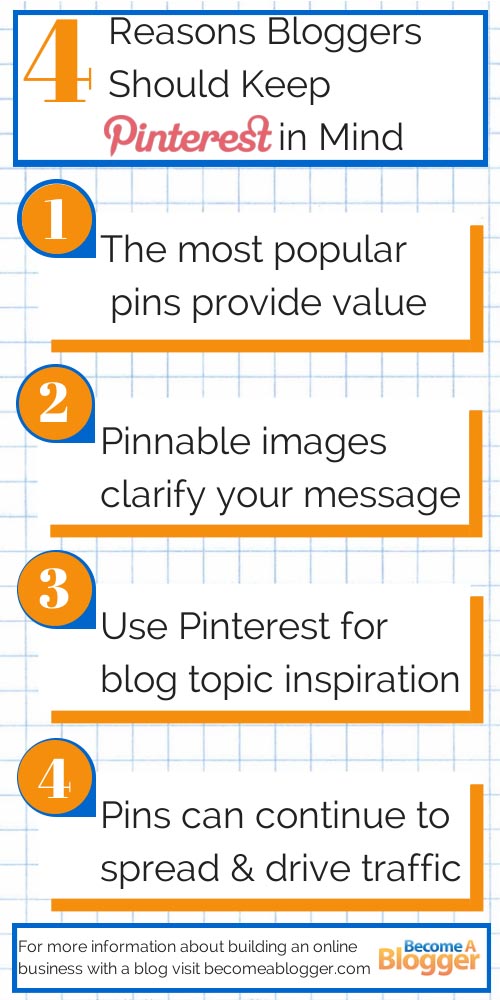
A recent list post on Become a Blogger was 4 Reasons Why Bloggers Should Keep Pinterest in Mind. Let's use that post to create an infographic to bring some new attention to it.
In this example, I used Canva to create the infographic. It's currently in beta but you can request an invitation to join, it's well worth the wait. A similar image could also be created in PicMonkey.
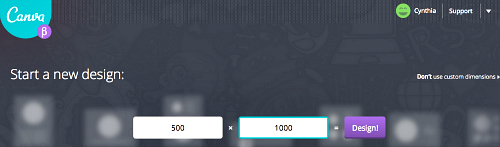
I chose to make the image 500 px wide by 1000 px tall I wanted it to be narrow enough to fit with the blog, tall enough to fit the information but not so tall that it overtakes the blog post. Keep in mind, infographics shared on Pinterest are now being truncated to 1935 px tall so try to keep them shorter than that.
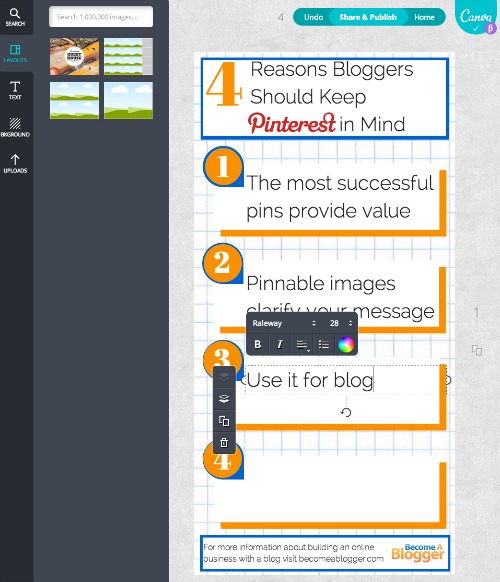
To keep with the Become a Blogger branding I chose an orange, blue and white color palette. For the background I uploaded an image of graph paper that I had in my image library. I then chose from the hundreds of free graphic elements available on Canva and changed the colors to keep them consistent.
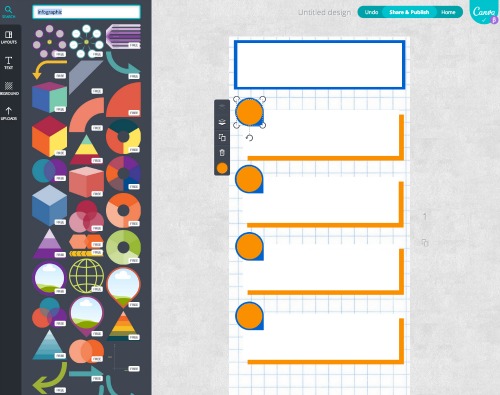
Once all of the graphics were complete, I added the summarized text from the list post, a call to action and the Become a Blogger logo at the bottom of the image. The font was kept simple and easy to read.
The completed infographic took about 45 minutes to create. Most of the time was spent choosing the layout and deciding which elements to use. This infographic is now ready to pin, post and tweet and bring a in new wave a traffic to the post.
You've already done all of the hard work of writing the list post, why not re-purpose the information in the form of an infographic and bring some new attention to it? It's not uncommon for infographics or images that provide a lot of content in one image to be pinned thousands of times on Pinterest.
Will you be creating infographics to revive your list posts? Let us know in the comments below.